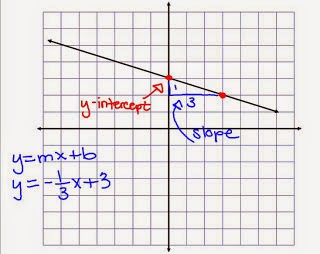
y= mx + b
The y is your output (dependent variable, range)
The x is your input (independent variable, domain)
You use these to plug in points to test if points are solutions of a line
The m is your slope which has to be written as a fraction to plot points using rise over run
The b is your y intercept

 |
| Negative Slope |
 |
| Positive Slope |
No comments:
Post a Comment